Tensorflow.org의 링크 내용을 정리함.
텐서보드 Scalar : 케라스에서 훈련지표(metrics) 로그로 남기기
ML은 변함없이 손실같은 주요 지표와 훈련시 그것들의 변화를 이해하는 것에 관련이 있다. 이 지표들은 오퍼피팅(overfitting)인지 혹은 불필요한 훈련이 너무 긴게 진행되는지 이해하는데 도움이 된다. 아마도 디버깅과 모델 개선을 위해 서로 다른 훈련에 대해 이들 지표를 비교할 필요가 있을 것이다.
텐서보드의 Scalars Dashboard는 손쉽게 간단한 API를 사용하여 이들 지표를 시각화 할 수 있게 한다. 이 글에서는 케라스 모델을 개발할 때 텐서보드에서 이 API를 사용하는 방법을 배우는데 도움이 되는 간단한 예제가 있다. 또한 default/custom scalar를 시각화하기 위한 TensorBoard callback과 Tensorflow Summary API의 사용법을 배운다.
Setup
Source>>

    from datetime import datetime
    from packaging import version

    import tensorflow as tf
    from tensorflow import keras

    import numpy as np

    print("TensorFlow version: ", tf.__version__)
    assert version.parse(tf.__version__).release[0] >= 2, \
        "This notebook requires TensorFlow 2.0 or above."
Result>>

    TensorFlow version:  2.1.0
간단한 회귀모델을 위한 데이터 준비
회구분석을 위해 케라스를 사용해 보자. 즉, 쌍을 이룬 데이터셋에 가장 적당한 선분찾는 것이다. (신경망과 경사하강법을 사용하는 것이 이런 종류의 문제에는 지나치지만, 예제를 쉽게 이해하는데 도움이 된다.)
Epoch마다 훈련과 테스트 손실이 어떻게 변화하는지 관찰하기 위해 텐서보드를 사용한다. 희망적이게도 훈련과 테스트 손실이 매번 감소하고 안정적이 되는 것을 보게 될 것이다.
우선 직선 $y=0.5x + 2$를 따라 개략적으로 1,000개의 포인트 데이터를 생성하고 이를 훈련과 테스트 셋으로 나눈다.
우리의 목적은 신경망이 이 관계를 학습하는 것이다.
Source>>

    data_size = 1000
    # 80% of the data is for training.
    train_pct = 0.8

    train_size = int(data_size * train_pct)

    # Create some input data between -1 and 1 and randomize it.
    x = np.linspace(-1, 1, data_size)
    np.random.shuffle(x)

    # Generate the output data.
    # y = 0.5x + 2 + noise
    y = 0.5 * x + 2 + np.random.normal(0, 0.05, (data_size, ))

    # Split into test and train pairs.
    x_train, y_train = x[:train_size], y[:train_size]
    x_test, y_test = x[train_size:], y[train_size:]
모델 훈련과 손실 로그 기록
이제 모델을 정의하고 훈련 및 평가해 보자.
훈련에서 손실 값 (loss scalar)를 로그로 남기려면, 아래 순러를 따라야 한다.
- 케라스 TensorBoard callback 생성
- 로그 디렉토리 지정
- 케라스 Model.fit()에 TensorBoard callback 전달
텐서보드는 로그 디렉토리 계층구조에서 로그 데이터를 읽는다. 이 글에서 로그 디렉토리는 *logs/scalars'이고 시간으로 표시된 하위 디렉토리가 접미사로 붙는다. 시간이 표시된 하위 디렉토리는 텐서보드를 사용하고 모데을 반복할 때 모델을 실행하는 것을 구분하고 선택하기 쉽게 만든다.
Soruce>>

    logdir = "logs\\scalars\\" + datetime.now().strftime("%Y%m%d-%H%M%S")
    tensorboard_callback = keras.callbacks.TensorBoard(log_dir=logdir)

    model = keras.models.Sequential([
        keras.layers.Dense(16, input_dim=1),
        keras.layers.Dense(1),
    ])

    model.compile(
        loss='mse', # keras.losses.mean_squared_error
        optimizer=keras.optimizers.SGD(lr=0.2),
    )

    print("Training ... With default parameters, this takes less than 10 seconds.")
    training_history = model.fit(
        x_train, # input
        y_train, # output
        batch_size=train_size,
        verbose=0, # Suppress chatty output; use Tensorboard instead
        epochs=100,
        validation_data=(x_test, y_test),
        callbacks=[tensorboard_callback],
    )

    print("Average test loss: ", np.average(training_history.history['loss']))
Result>>

    Training ... With default parameters, this takes less than 10 seconds.
    Average test loss:  0.04655971171800047
텐서보드를 이용한 손실 검사
위에서 사용한 로그 디렉토리를 사용하여 텐서보드를 시작하자.
Console>>

    > tensorboard --logdir=logs/scalars

"No dashboards are active for the current data set"이라는 텐서보드 메시지를 볼 수도 있다. 이것은 최초 로그 데이터가 아직 저장되지 않아 나타나는 것이다. 훈련 진행 동안, 케라스 모델은 로그 데이터를 기록하기 시작한다. 텐서보드는 주기적으로 갱신하여 scalar 지표를 보여준다.
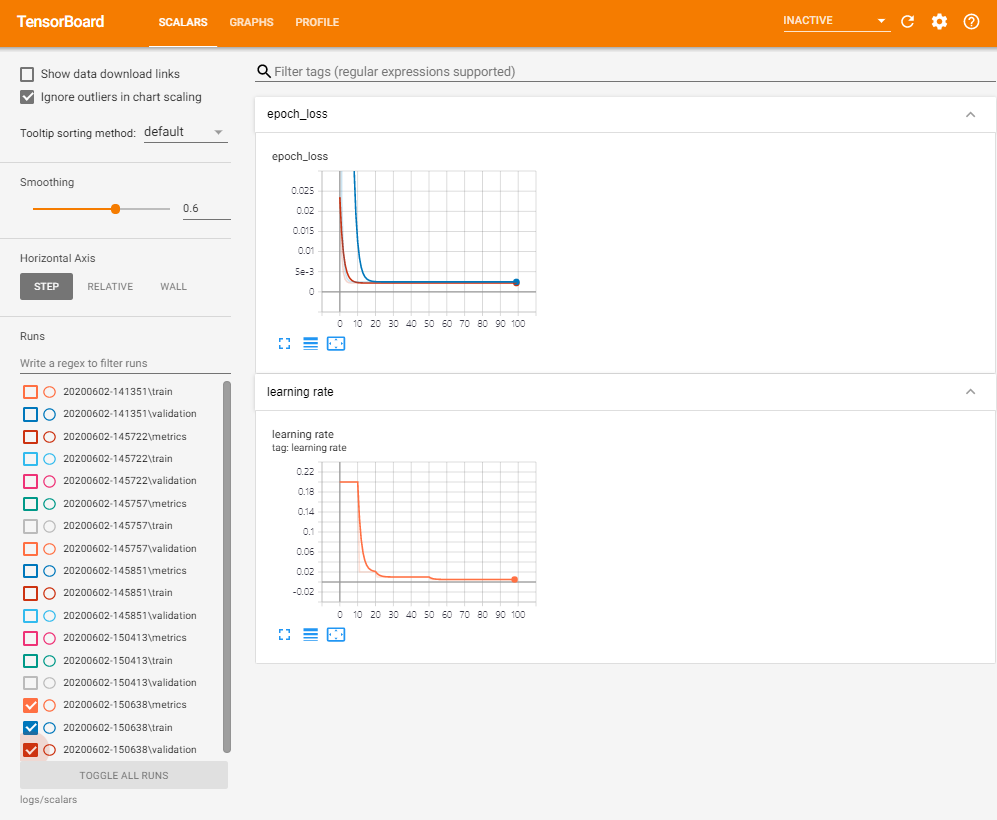
훈련 진행을 지켜볼 때, 훈련과 검증 손실 양쪽 모두가 얼마나 빠르게 감소하는지 그리고 안정된 상태로 되는지에 주목하자. 사실, 20 epochs이후에 훈련이 개선되지 않기 때문에 훈련을 중지하는 것이 가능하다.
그래프 위에 마우스 포인터를 올리면 자세한 데이터 포인트를 볼 수 있으며, 마우스로 줌 인/아웃하거나 좀 더 자세하게 보기 위해 부분적으로 선택할 수 있다.
좌측의 'Runs'는 한차례 훈련에 대한 로그를 나타내는 이번 예제의 경우, Model.fit()의 결과인 'run'을 선택할 수 있는 메뉴이다. 개발자는 매번 모델을 실험하고 개발할 때, 아주 많은 'run'을 갖게 된다.
텐서보드 손실 그래프는 훈련과 검증에 대해 지속적으로 감소하고 안정화된 손실을 보여준다. 이는 모델의 지표가 아주 좋을 가능성이 있다는 것을 의미한다. 이제 실생활에서 실제 모델이 어떻게 동작하는지 보자.
입력 데이터 (60, 5, 2)가 주어지고, 직선 $y = 0.5x + 2$가 (32, 14.5, 3)을 산출한다면, 모델이 이를 수용하는가?
Soruce>>

    print(model.predict([60, 25, 2]))
    # True values to compare predictions against:
    # [[32.0]
    #  [14.5]
    #  [ 3.0]]
    [[32.234306 ]
     [14.5974245]
     [ 3.0074697]]
나쁘지 않다.
Custom scalars 로그
동적 학습률(Dynamic learning rate) 같은 custom 값을 로그로 남기기 위해서는 TensorFlow Summary API를 사용해야 한다.
모델을 재훈련하고 custom 학습률을 로그로 남기기 위해 아래와 같이 진행한다.
- tf.summary.create_file_writer()를 사용하여 file writer 생성
- Custom 학습률 정의. 이는 케라스 LearningRateScheduler 콜백에 전달됨.
- 학습률 함수 내부에서, custom 학습률을 로그로 기록하기 위해, tf.summary.scalar() 사용
- Model.fit()에 LearningRateScheduler 콜백 전달
보통, custom scalar를 로그로 남기기 위해서는 file writer로 tf.summary.scalar()를 사용해야 한다. File writer는 해당 실행에 대해 명시된 디렉토리에 데이터를 쓰며 tf.summary.scalar()를 사용할 때 암시적으로 사용되어 진다.
Source>>

    logdir = "logs/scalars/" + datetime.now().strftime("%Y%m%d-%H%M%S")
    file_writer = tf.summary.create_file_writer(logdir + "/metrics")
    file_writer.set_as_default()

    def lr_schedule(epoch):
        """
        Returns a custom learning rate that decreases as epochs progress.
        """
        learning_rate = 0.2
        if epoch > 10:
            learning_rate = 0.02
        if epoch > 20:
            learning_rate = 0.01
        if epoch > 50:
            learning_rate = 0.005

        tf.summary.scalar('learning rate', data=learning_rate, step=epoch)
        return learning_rate


    lr_callback = keras.callbacks.LearningRateScheduler(lr_schedule)
    tensorboard_callback = keras.callbacks.TensorBoard(log_dir=logdir, profile_batch=100000000)

    model = keras.models.Sequential([
        keras.layers.Dense(16, input_dim=1),
        keras.layers.Dense(1),
    ])

    model.compile(
        loss='mse', # keras.losses.mean_squared_error
        optimizer=keras.optimizers.SGD(),
    )

    training_history = model.fit(
        x_train, # input
        y_train, # output
        batch_size=train_size,
        verbose=0, # Suppress chatty output; use Tensorboard instead
        epochs=100,
        validation_data=(x_test, y_test),
        callbacks=[tensorboard_callback, lr_callback],
    )
텐서보드를 보자
Console>>

    tensorboard --logdir logs/scalars

또한 해당 실행의 학습과 검증 손실 곡선(loss curve)을 이전 실행과 비교할 수도 있다.
이 모델은 어떨까?
Source>>

    print(model.predict([60, 25, 2]))
    # True values to compare predictions against:
    # [[32.0]
    #  [14.5]
    #  [ 3.0]]
Result>>

    [[32.234013 ]
     [14.5973015]
     [ 3.0074618]]